visualization
-
Decision Tree Visualization with pydotplus
A useful snippet for visualizing decision trees with pydotplus. It took some digging to find the proper output and viz parameters among different documentation releases, so thought I’d share it here for quick reference.

-
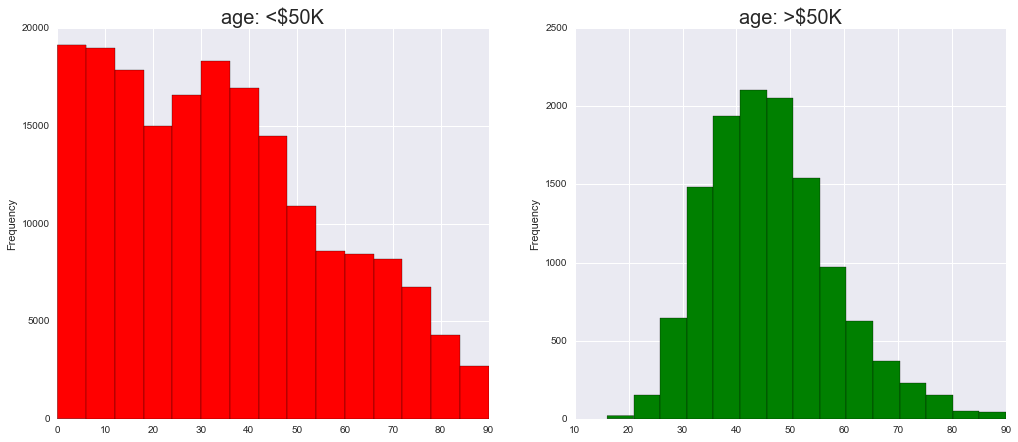
Income Analysis – US Census Data
A couple months back, I worked on analysis and predictive modeling of US salary given census data. Full Jupyter notebook here, below are some details and some of the more interesting findings. In general, metadata is below and contains lots of null values (as you might suspect of census data).
-
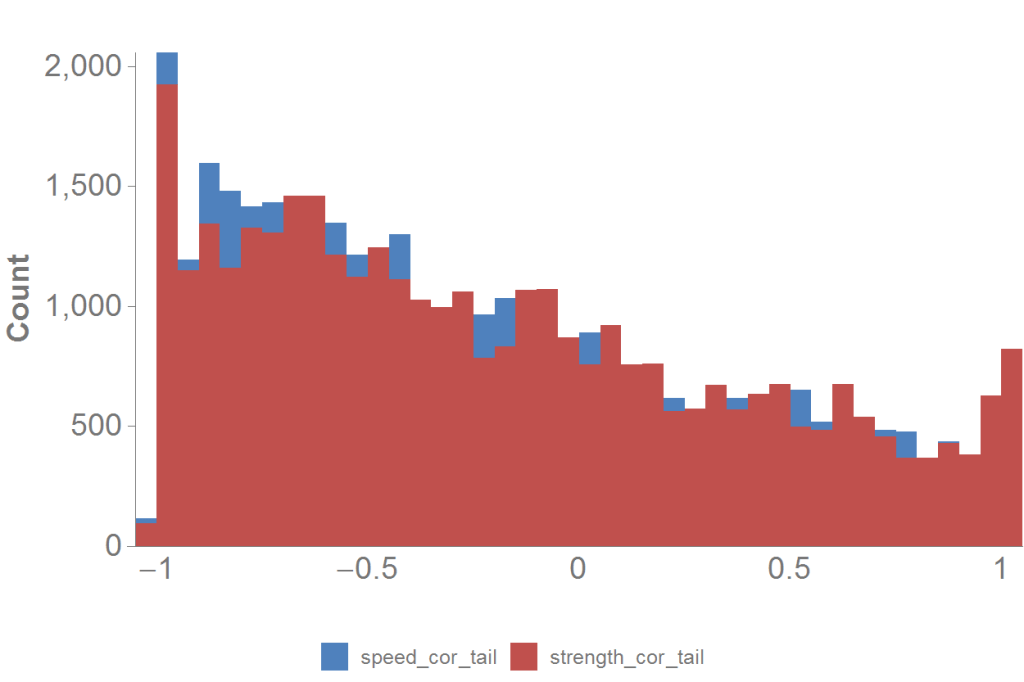
What Goes First – Speed or Strength?
I recently had access to a lot of baseball data, specifically data on every season of every player in the history of the MLB going back to 1871. Here’s some analysis on how baseball players lose speed and strength (or both) throughout their career. Analysis primarily consisted of variable creation and data queries. Unfortunately, code not available…
-
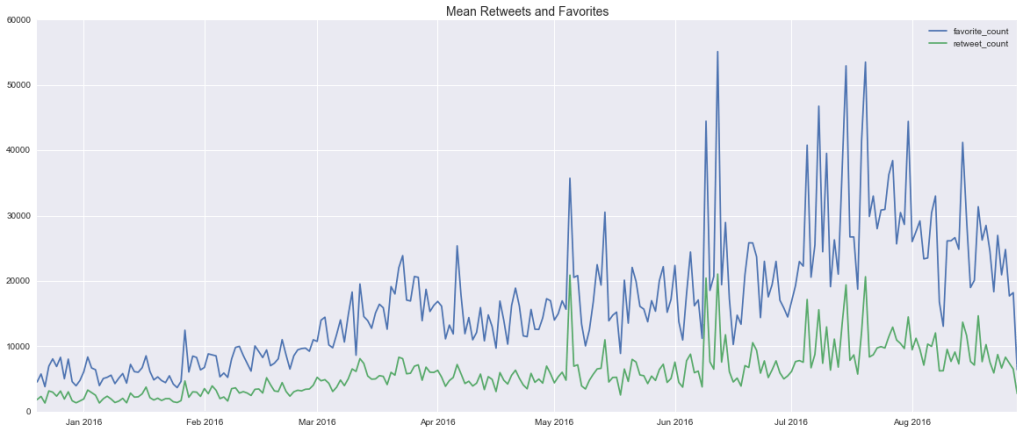
Trump Tweet Analysis
This project stems from two overarching questions: Which emotions do politicians most frequently appeal to? I recently saw a BuzzFeed presentation on, among other things, the virality of BuzzFeed content. A big part of their business relies on understanding what kind of content goes viral and why, so their data science team understandably spends a lot…
-
Article Classification and News Headlines Over Time
How does front page news track a single topic over a period of time? What’s the media’s attention span for a given story? In general, many find it surprising how quickly major media outlets shift their attention from one story to another. This is partly a reflection of our own attention spans and appetites, and…
