Summary
Most head-to-head LLM ranking (like the LMSYS arena) is calculated with the Elo rating system based on user comparisons between two LLM responses. Elo was developed to rank chess player strength over time. It’s been adapted for LLM ranking, but this adaptation has several problems, including:
- Elo weighs the contribution of recent matches differently from the contribution of older matches in order to account for players that change over time, but LLMs are static (assuming we pin them to a specific version.)
- Elo traditionally scores head-to-heads produced by a reliable process such as “who won the game?” whereas LLM evaluations are the product of multiple human evaluators with different preferences, whose preferences are exaggerated not only in judging the LLM responses, but in choosing the question for the LLM to respond to.
In this post we test out some alternative ranking methods borrowed from voting theory (also called social choice theory) using the raw LMSYS ranking data.
We’ll simulate LLM voting scenarios under varying distributions of voter preferences/skills against model abilities in order to test these ranking methods against Elo (and Bradley-Terry, Elo’s “offline” version, implemented in LMSYS as of 12/2023).
In almost every simulation, it seems that adopting Copeland method or Ranked pairs would result in much more faithful rankings. These experiments carry broader implications for any scenario where we are concerned with preference modeling and ranking.
To recreate and run your own simulations you can access the Colab notebook here.
A big thank you to Marc Lanctot for feedback and discussion.

Introduction
Elo has been used to rank the performance of competitors across a wide number of games. There are plenty of known drawbacks with Elo. This paper from Cohere (also the inspiration for this post) discusses problems with transitivity and reliability, but there are far more issues.1 A large number of modification have been introduced to try and remedy these problems.2
I want to explore a more radical re-evaluation: recognize that LLM comparison can and should be framed not as players competing in a game, but as voters electing candidates. If you accept that this is a more appropriate framework for LLM comparison, then you can borrow from the field of voting theory, also called social choice theory, and use it to explore better ranking models. Voting theory is a mathematical/economic/poli-sci field that “analyzes methods of combining individual opinions, beliefs, or preferences to reach a collective decision,” meaning how do we count and tally votes fairly. Included in the literature is how to prove under certain voting and tallying methods that certain axioms and rational or irrational outcomes obtain. Using the results from this field, we can get different theoretical guarantees about the accuracy of our ranking depending on which method we choose.
Reframing the problem and experiment setup
So why should we reframe it this way? One way to think about this is to remember that Elo was specifically designed for chess evaluation, and to examine the ways that LLM evaluation is not like chess evaluation and is therefore a mismatch for the modeling assumptions that belong to Elo.
- The first reason is about candidates that are static vs change over time. Elo is built to handle player strength that changes over time, which is not the case with LLMs. Voting theory does not make this assumption, and therefore we can eliminate the problems of hyperparemeter and K-factor tuning in Elo, as well as the variability in its outcome subject to the re-ordering of its inputs.
- The second reason is about what process we use to determine the outcome of a match or head-to-head comparison. In chess, the outcome of a comparison is determined by who won the game, a single, unbiased process. For LLM evaluation the outcome of a comparison is determined by multiple human raters with different preferences. 3 Voting theory again is better suited here because it explicitly tries to aggregate different individual preferences into a fair collective preference, and doesn’t assume that outcomes are generated by a singular, perfect, or reliable process. So there is room to model the unreliability, inconsistency, and uncertainty that comes from having different humans with different preferences act as judges, and to adapt our ranking method to that model.
From this perspective, chess and LLM evaluation are almost inverse of one another: chess has inconsistent candidates under a static evaluation system while LLM evaluation has static candidates under an inconsistent evaluation system. I would argue voting theory offers a potentially better fit. Additionally, accounting for the unreliability of outcome inherent in using different human judges should be accounted for when choosing a ranking method.
Some researchers at DeepMind actually had this same insight and tested out different methods as informed by voting theory (see the paper for a much more thorough exploration of voting theory’s application to LLM/agent evaluation). What follows is an extension of these ideas applied much more specifically to the case of LLM ranking, with a particular emphasis on changing the distribution of voter skill and examining the effect it has on ranking outcomes:
- We’ll model the unreliability/uncertainty associated with having different human judges with different preferences. We’ll run simulations under different distributions of voter preferences and empirically evaluate how different voting theory methods and Elo perform under these conditions.
- We’ll test out the best-performing method on the LMSYS data directly so we can compare it to the current rankings.4
Simulating the voting process
Let’s attempt to simulate the effect of voters with different preferences.
Simulating candidates
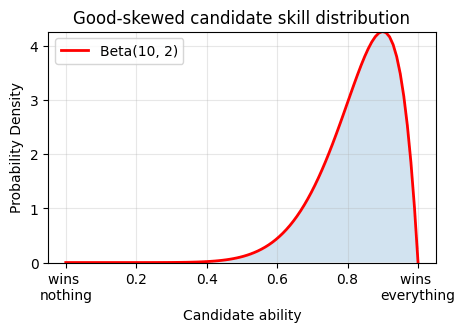
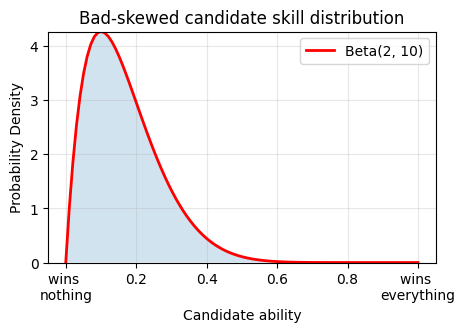
First let’s assume that different LLM models, referred to as “candidates” have a hidden underlying quantity of “ability,” meaning if ability(candidate A) > ability(candidate B) then then a perfect and unbiased voter will always say that candidate A is the winner (whereas voters are not perfect and unbiased, and will with some probability choose candidate B due to their unique preferences or a mistake in judgement).
We can interpret candidate ability as total general ability, but also as some average of different underlying abilities in the same way that LLM ability is often measured as the average score across different benchmarks that test various abilities (math, reasoning, knowledge, coherence, fluency, etc).
By doing this, we have an objective true ranking of candidates that we can compare against the predictions of different voting theory methods and Elo as a function of votes. This true ranking will serve as our benchmark.
For the sake of comparison, we will run simulations where candidate ability is uniformly distributed, good-skewed (beta distribution), or bad-skewed (beta distribution):
Simulating voters
We can treat the preferences of LLM judges, referred to as “voters,” as ground truth. Alternatively, we can understand different voters as being good judges, bad judges, bad actors, or obeying unique sets of preferences (style, factuality, assertiveness, coherence, humor, tone, etc).
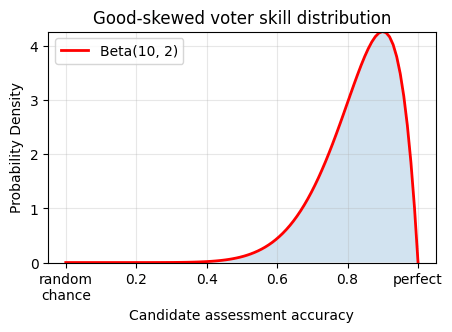
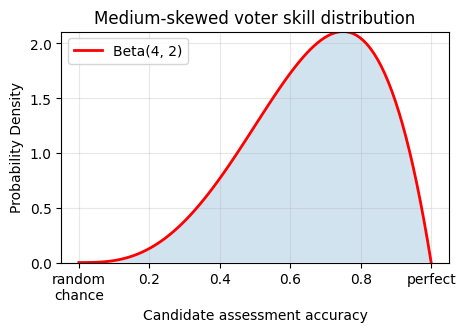
We can interpret voters in the same way as candidates, as having general skill in discerning the best candidate, but also as individuals possessing a unique underlying distribution of preferences that cause the voter to rate a candidate in a way that diverges from the “optimal” ranking. In this way, a range of voter “skill” in assessing candidates reflects both that people are not perfect judges, but also acts as a catch-all for the discrepancy of preferences that different voters will show. This is very appropriate given that voters will not only consult their preferences when judging the response of the LLMs, but will undeniably act on their personal preferences when asked to prompt the LLMs with a question of their choosing.
(NB / aside: in general, there’s some general margin of error / variance in the voting outcomes. This variance can come from imperfect voter discernment or from variance in model outputs. Clearly, both are true; people judge imperfectly and models underperform/overperform across a range of tasks relative to peer models. For this analysis we localize this variance in the voter, but one could easily perform the same analysis localizing error in model ability, or in both. Regardless, the outcome of analysis should be the same.)
For the sake of comparison, we will run simulations where voter skill is perfect (meaning the voters will always select the better candidate), good-skewed (beta distribution), medium-skewed (beta distribution), or bad-skewed (beta distribution):

Simulating the voting process
How often do voters vote?
To get a realistic sense of the numbers that are used to judge LLMs, we can take a look at the LMSYS data, for example:
- Number of votes: 1670250
- Number of voters: 477322
- Number of candidates: 129
- Average votes per voter: 3.5
- Median votes per voter: 1
- Percentage of voters who voted once: 56%
- Maximum votes cast by one voter: 4635
Most voters vote once, and the rest vote roughly on a power law distribution.
In the simplest form, we can just have each voter vote approximately 3.5 times. In another setup, we experiment with assigning each voter a number of ballots to cast based on the custom voter distribution seen above.5
We will initialize:
- n voters
- m candidates
- t target votes
Each voter will review the (m*(m-1))/2 total possible candidate pairwise comparisons (excludes self-comparison). Because most voters only cast a handful of votes, the probability that a voter will cast a vote for a given comparison is p, where:
- in the uniform case, p = t/n * 1/possible_matchups, meaning that each voter will vote approximately t/n times.
- in the power law case, p is assigned based on the voter distribution seen above such that we achieve roughly t total votes.
Each voter will be shown all possible (m*(m-1))/2 candidate pairwise comparisons, and with probability p will vote on them. This ensures that every matchup is equally likely to receive votes.
When do voters diverge from the optimal candidate?
In this setup, the probability that the voter makes a correct comparison is:
p_correct = 0.5 + (skill * 0.5)
where skill is drawn from a voter skill distribution, as shown above.
This formulation ensures that voters are never worse than chance. It also useful to note that voter skill is slightly less than the voter’s probability of judging a comparison correctly. For example, using this formula a voter with a skill of .8 will correctly judge a matchup with a probability of .9.
A random number r is drawn, and if r < p_correct then a correct judgement is made, otherwise an incorrect judgement is made.
Voter skill is partly a function of the difference in ability between the models
There’s one additional adjustment included here: voter skill should also be a function of the relative skill of the two candidates. When two candidates have very similar underlying ability, then it is reasonable to assume that a voter’s preferences can sway them away from the better candidate towards a slightly worse response. However, when two candidates have vastly different abilities (like comparing GPT-2 to GPT-4), even unskilled voters shouldn’t have any preference that would cause them to choose a vastly inferior response. Therefore we increase voter skill at each matchup as a function of the absolute skill difference (ranging 0-1) between candidates:
updated_skill = 1 – (1 – skill) * exp(-k * diff**n)
where diff = abs(model_A_ability – model_B_ability), and k and n are constants fixed at k=3 and n=3.
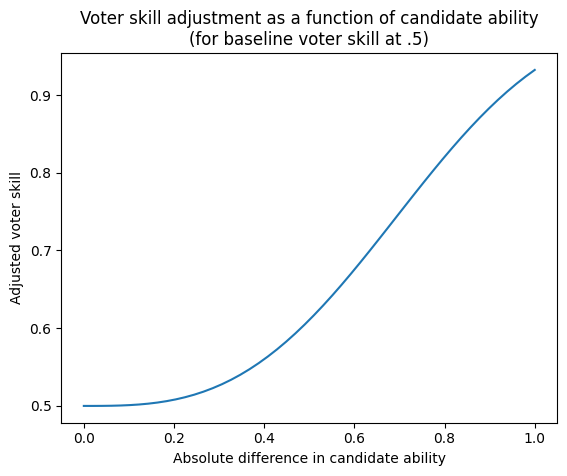

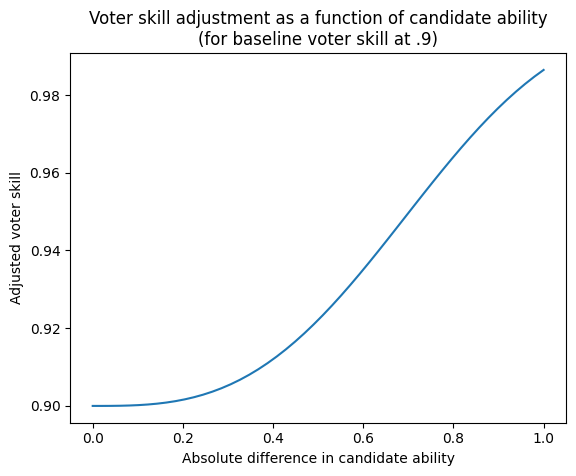
The result is that during a round when candidates are similar, voter skill remains largely the same as it was initialized. As the discrepancy between candidate ability increases for a given round, adjusted voter skill approaches perfect discernment between candidates, but strictly for that round of comparison.
Tallying the votes
After each voter has completed their turn voting, votes are tallied into a pairwise comparison matrix. Different methods of calculating a rank will use that data to create a ranking, and this ranking will be compared against the true model ability using Kendall’s tau.
Simulation Results
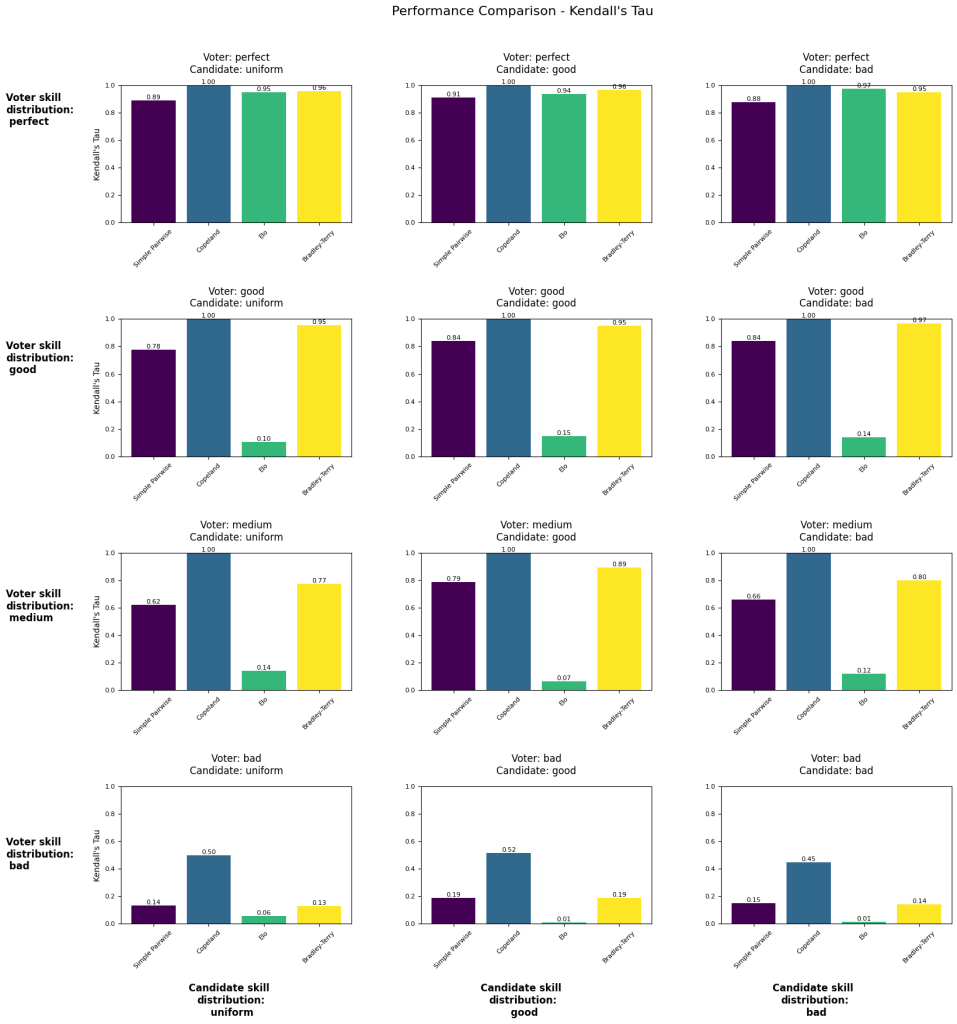
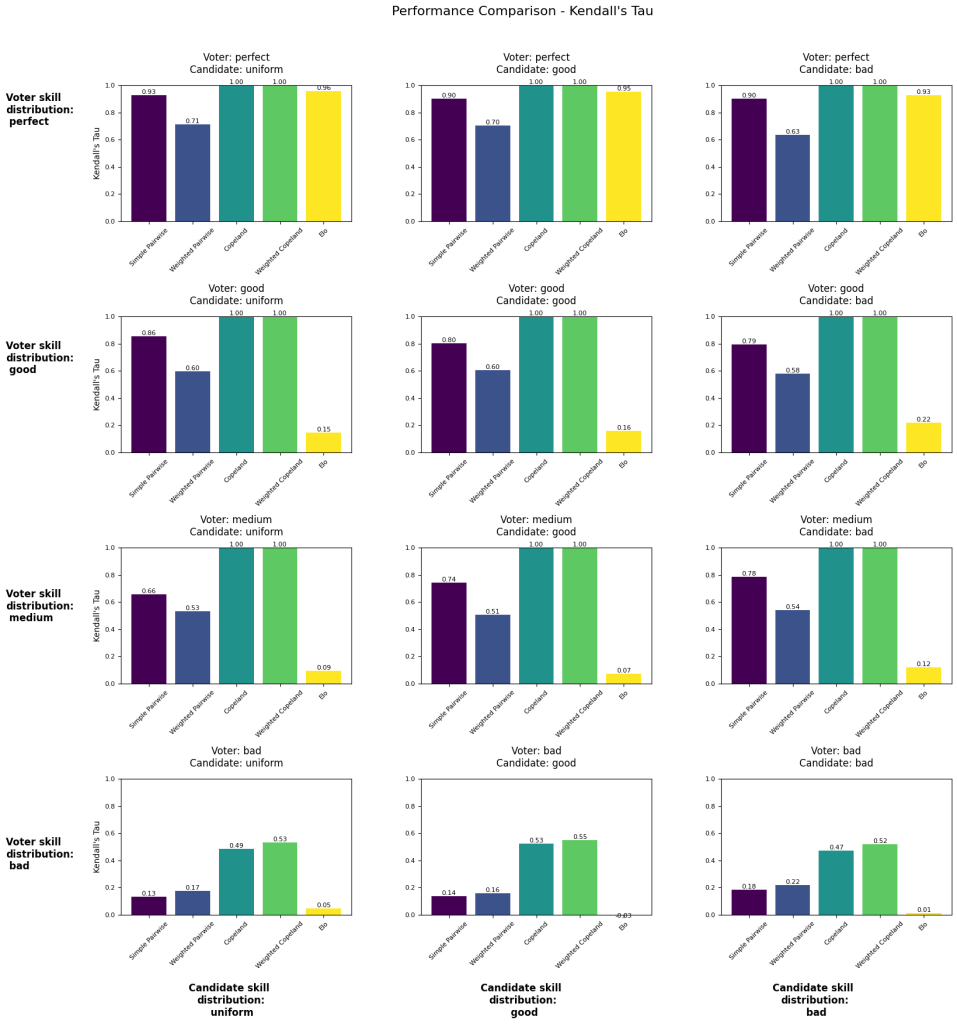
The following visualizations shows different voting simulations varying across voter skill (by row) and candidate skill (by column). The number reported is Kendall’s tau as measured against the true candidate skill (1 is perfect recovery of ranking, -1 is total inversion of ranking).
“Simple Pairwise” and “Copeland” are methods borrowed from voting theory. “Bradley-Terry” is the system currently used to calculate the LMSYS leaderboard. Our Elo calculation uses k=4, initial rating=1000.
Experiment #1 provides no skill adjustment to voters (as discussed in the previous section) and the distribution of votes cast per voter is uniform.
Experiment #2 provides skill adjustment to voters and the distribution of votes cast per voter is along the power law distribution seen in the actual LMSYS voter data.
Experiment #1
- Number of voters: 477322
- Number of candidates: 129
- Number of votes: ~1.6M
- For each setup, averaging results over n simulations: 2
- Voter skill adjustment: no
- Number of votes per voter: uniform
Experiment #1 Follow-up: test Ranked pairs (Marc’s suggestion) against Copeland:
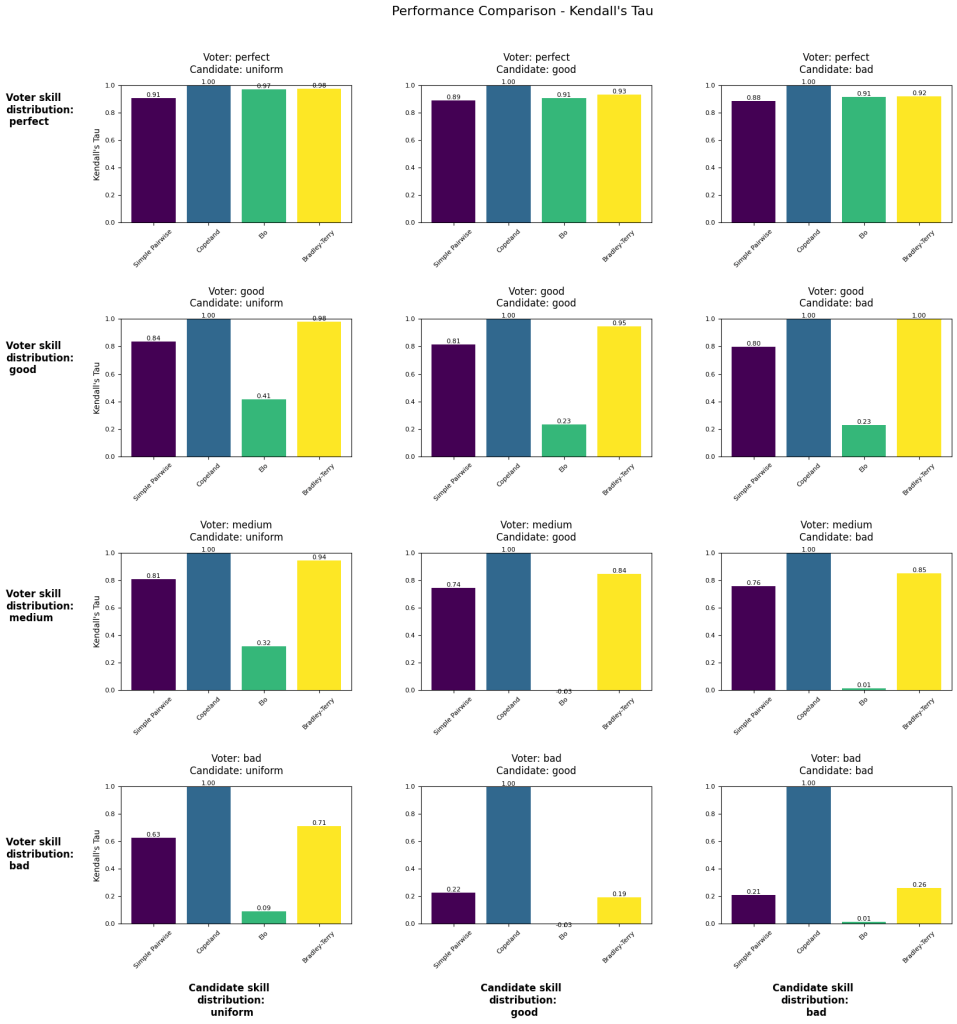
Experiment #2
- Number of voters: 477322
- Number of candidates: 129
- Number of votes: ~1.6M
- For each setup, averaging results over n simulations: 2
- Voter skill adjustment: yes
- Number of votes per voter: power law distribution
Experiment #2 Follow-up: test Ranked pairs (Marc’s suggestion) against Copeland:

Summary of results
- When we assume voters have a perfect ability to discern candidate ability, then Elo and Bradley-Terry perform well regardless of how the candidates are distributed.
- Bradley-Terry outperforms Elo under nearly all conditions.
- As voter skill becomes less than perfect, Ranked pairs appears to be a much better method for recovering the true candidate ability ranking.
- Even in the case of perfect voter ability, Ranked pairs still outperforms Bradley-Terry, indicating that you could reject the main premise of this post – that voters are imperfect judges – and you’d still be better off using Ranked pairs.
- The distribution of candidate skill doesn’t seem to have much of an effect on rankings.
- The poor performance of Elo a little suspect – it doesn’t seem correct that Elo rankings would collapse given a little uncertainty in voter outcomes.
The code is available here, so you can run simulations under different condition and see which method ends up better. Note that running a single simulation takes approximately 40 minutes on the Colab instance as is, so running results like the above (iterating over scenarios and repeating simulations to obtain a fair average) can take a long time.
LLM rankings revisited: LMSYS data ranked using Copeland’s method and Ranked Pairs
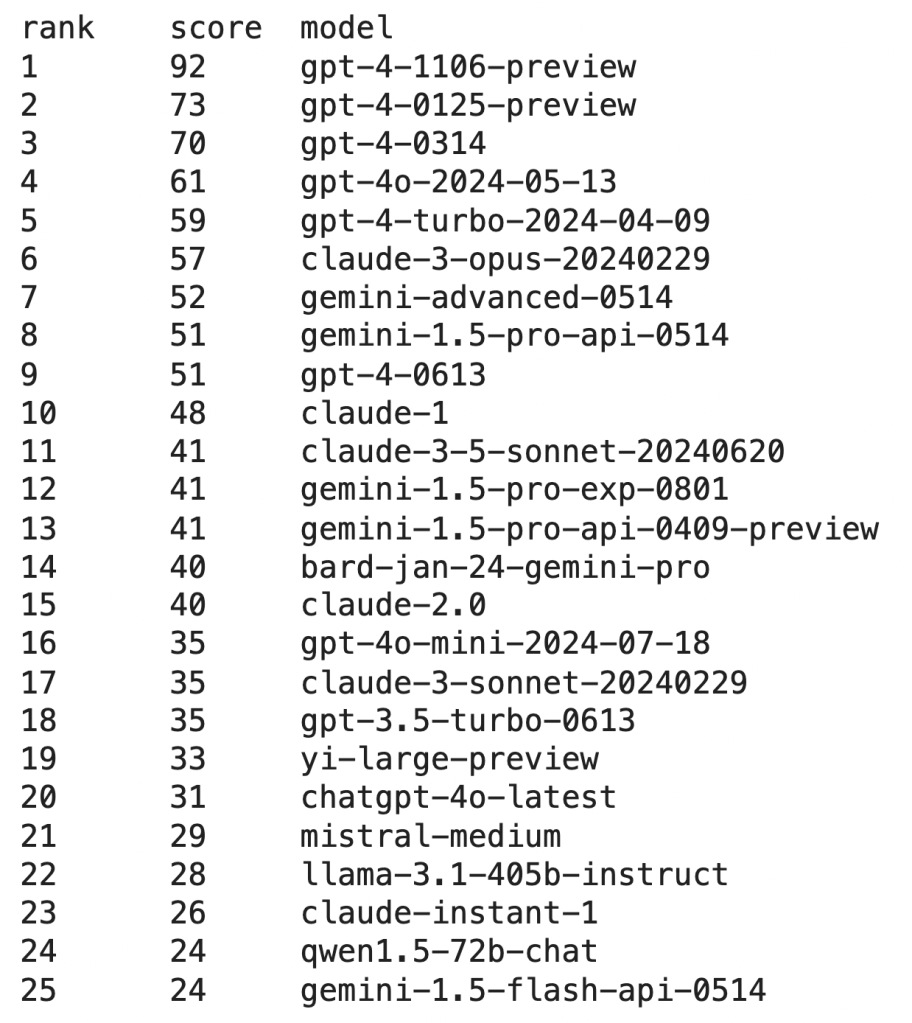
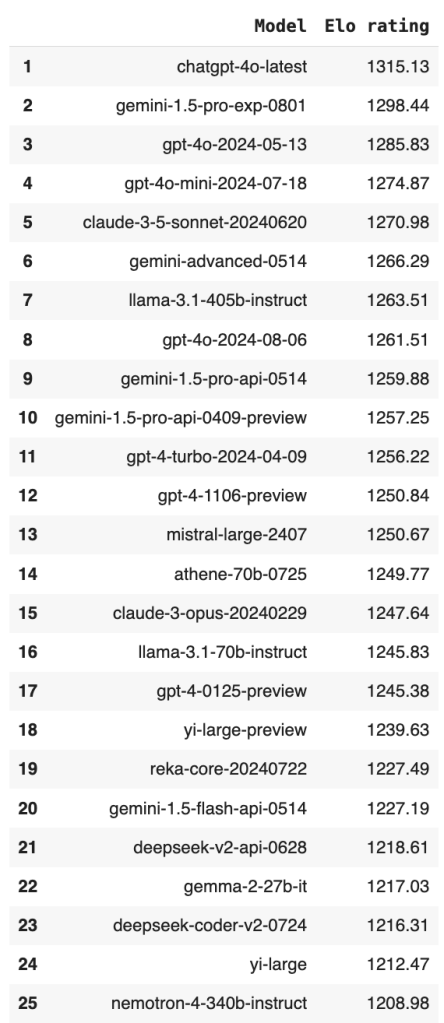
Using Copeland’s method (left) we obtain the following ranking which we can compare to the Bradley-Terry ranking (right) provided in the LMSYS notebook containing the same data (a snapshot of data from 2023):
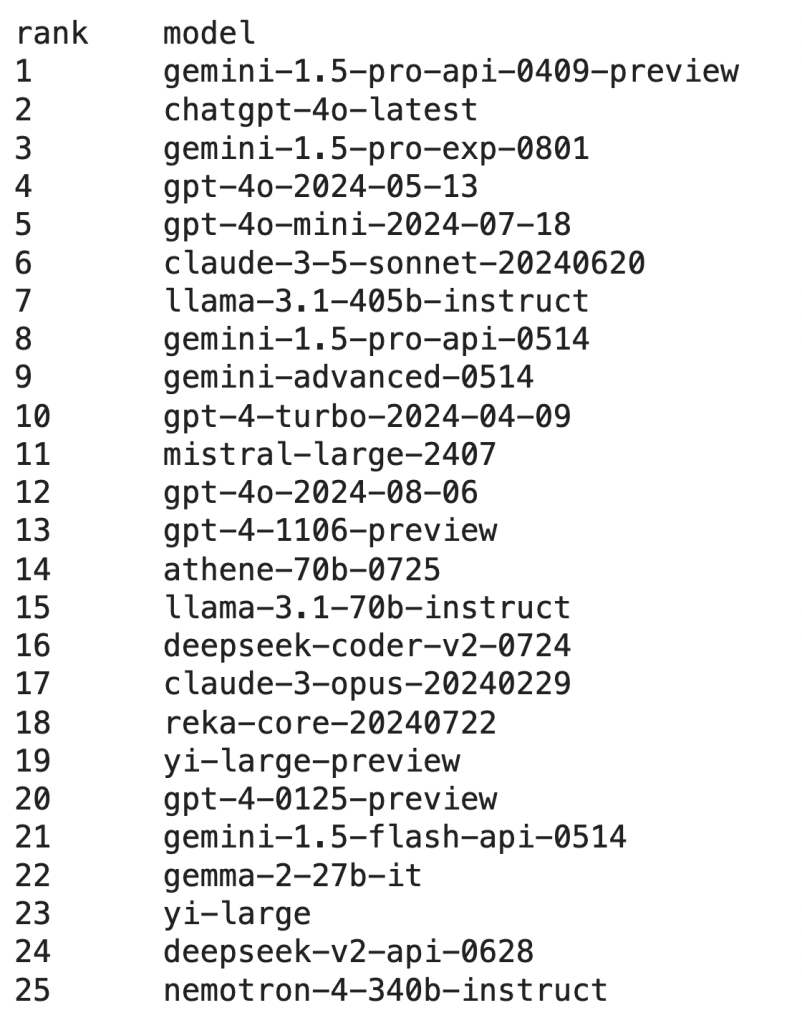
And here is the Ranked pairs (left) ranking we obtain against Bradley-Terry ranking (right):
Is this good?
I’m not sure. I haven’t used all of these top 25 models, but they’re all big LLMs from top labs, and I’d guess at the highest level they’re all somewhat close to one another. There’s no obvious way to tell if this reshuffling represents an improvement over Bradley-Terry, and obviously there is no objective ranking we can evaluate against.
I would argue that the absence of a clear empirical benchmark only reinforces the idea that we should doubly focus our attention on methodology as is attempted in this post.
Future directions
Room for improvement? Reweighing votes based on voter skill doesn’t change much
At the time of voting, we don’t know which voters have high skill and which voters have low skill.
A simple way to improve ranking results is to assess voter skill after all votes are in and re-weight the votes based on whether they come from a skilled or unskilled voter.
There are many ways to determine how you rank voters, but a simple idea is that voters who consistently vote with the majority are probably good judges, while those who are consistently voting agains the majority should probably be regarded with suspicion. I like this method because a good voter can be interpreted as “this person is a “model” voter” or “regardless of their preferences, this person can predict the majority preference well.”
A simple way to account for all this is to count each and every vote as +1, and then go back and add some fractional bonus points to the votes of “good” judges. In this way bad judges aren’t penalized and their vote still counts, but good judges get rewarded.There are a hundred other ways to do this6, but we’ll stick to this method for now.7
This is implemented (and can be seen in some experiments) as “weighted Copeland” and “weighted pairwise.” However, results are largely the same, and a little worse in most instances.
Experiment #3
- Number of voters: 477322
- Number of candidates: 129
- Number of votes: ~1.6M
- For each setup, averaging results over n simulations: 5
- Voter skill adjustment: no
- Number of votes per voter: uniform
Future direction: further analysis/ablation
There are many more variables to explore, including:
- Ratio of voters to candidates
- Changing distribution or frequency of how often voters vote
- Different distributions of candidate ability
- Different distributions of voter skill
- Updating voter skill under different k and n parameters
- Allowing self-comparison – study the reliability of voters by occasionally giving them a head-to-head comparison of a model against itself (with some randomness injected to prevent identical responses). A perfect record of ties suggests reliable voters. A record of preference for one or the other suggest unreliable voters or a large underlying variance in model quality round to round that should be factored into further analysis
- Simulating the fact that some models receive far more votes than others (presumably LMSYS samples from recent/better models to help keep the most competitive and relevant model rankings accurate).8 Ranking methods might look very different when there is no longer a roughly even distribution over all pairwise comparisons, and some methods from voting theory are well-known to suffer under these conditions.
Future direction: ties and different voting mechanisms under voting theory
This model does not allow for ties, nor does it explore modifications to the voting design. Voting theory may provide clear direction on the pros and cons of different voting setups. For example, how accurate and informative will rankings be if we:
- Rank two models
- Rank two models and allow for ties
- Rank three models
- Rate n models on a scale from 1-5
In general, we could test other voting templates, again drawing specific strengths and theoretical guarantees from voting theory literature.
Lastly, there are many other ranking methods to try. Thus far I have only tried the ranking methods reported here, with the exception of Schulze and weighted Schulze, both of which performed poorly.
Future direction: interpreting this study as a direct counterpart to the training of Reward Models
Training of reward models follows a very similar setup to the Elo ranking and comparison of LLMs, often taking the form of asking users “do you prefer response A or response B?”
Voting theory may provide ideas about ways to better elicit more informative, less biased, or more nuanced user preferences through the design of the comparison interface, type of questions asked, and aggregation of these preferences.9
We should be able to apply some learnings here to the training of reward models and directly measure these effects during the reinforcement learning stage of training.
[Edit: this paper explores this exact idea and derives a method with good theoretical guarantees]
Future direction: voter skill as a combination of underlying preferences over n qualities
Simulating voter skill and candidate ability not with a single number, but as n different qualities generated under different distributions is an interesting direction.
For example, model coherence is sampled from a distribution parameterized one way, factuality is sampled from a distribution parameterized another way, etc. while voter preferences about these qualities are sampled from their own respective distributions. In this way, we can study the effects on ranking as we vary the importance and character of the distribution of different qualities.
Leaderboard manipulation/gaming:
While crowd-sourced pairwise comparison is ostensibly a fair measure of LLM ability, it is possible to exploit voter preferences to obtain a “better” ranking by optimizing a model for qualities that are strongly preferred by voters, independent of how those qualities relate to “true” ability.
For example, this paper argues that more assertive responses are preferred over less assertive responses, and that this preference is not related to the factuality of the response. We can simulate scenarios like this to see the effect on voter preferences and overall ranking.
Footnotes
- A non-exhaustive list of the drawbacks of Elo:
– Can’t represent non-transitive relationships (e.g. Rock, Paper, Scissors)
– Can fail to represent transitivity where it should exist
– Introducing clones can lead to problems
– The k-factor (responsible for how much weight to give to more recent matches) needs tuning
– Rating inflation/deflation
– Subject to manipulation by sitting on a high rating or strategically picking opponents ↩︎ - For example, as of December 2023, LMSYS has moved away from Elo towards the Bradley-Terry model. ↩︎
- Up until now we’ve pretended that this comparison is equivalent to a game with one winner and one loser; this assumption makes Elo applicable. ↩︎
- This is just a preliminary application of voting theory methods to our problem; I threw all these experiments together with Claude’s help over the long weekend. The DeepMind paper does a much more thorough job, and I’m sure still more could be accomplished sitting beside a subject matter expert. ↩︎
- For large numbers of voters these methods should both be approximately equivalent, but for smaller numbers of voters the preferences of the few individuals who vote a large number of times under the power law distribution may skew the results. ↩︎
- I’m tempted to incorporate the fact that some head-to-heads have lots of votes while others have just a handful, and therefore the information from a voter who votes with the majority of a popular contests is more robust than voting in the majority of a less popular contest, but that is mostly a digression. ↩︎
- Straying from voting theory, this kind of “how do we weigh the rankings of different users” is probably more in the domain of social media companies who try to figure out how seriously to weight the Yelp reviews of someone who gives 5 stars across the board, 1 star across the board, trolls, etc. I assume there is endless sophistication and tinkering here. ↩︎
- There’s more to parse and analyze here, but it’s broadly a data collection / data bias case. Again, I think this is probably necessary since we can’t collect all votes required for total pairwise comparison, and doing so would be a waste of effort since some matchups are unnecessary to evaluate (old/worse models vs. the latest releases). ↩︎
- As far as I know the “A or B” template is preferred for a number of reasons: simplicity, and ease of interpretation… However it’s worth seeing what effect a more rigorous feedback template has, both in providing more information about different response qualities, but also in forcing voters to think critically and carefully before submitting a judgement. This is comparable to training the model to act like the casual median voter instead of a very clever, literate, careful reasoner. ↩︎
